In part 1 of this article, we summarized 4 main rules to follow to ensure we are creating and running profitable PPC campaigns. We explored 3 rules out of 4 for the following: 1) Accrue enough data. 2) Budget for success. 3) Narrow targeting.
Now, in part 2, we’ll provide some examples for creating narrow target campaigns. Then, we’ll jump into our 4th and final rule for profitable campaigns – Understanding trends.
- Rule 3: Examples of narrow targets
- Rule 4: Understanding Trends.
Examples of Narrow Targeting
The concept of narrow targeting applies to any ad platform out there – Google, Microsoft, Facebook, LinkedIn Ads, etc. Also, as we discussed before, it is possible to set narrow targets and still gather enough data for the campaigns to learn and work efficiently.
*Narrow targeting does not mean low search volume.
When I refer to ‘narrow targeting’, I’m talking about strict targeting rules. What are those? Well, Google Ads uses keywords as targets, instead of broad match focus on exact match. Facebook would use pre-determined audience lists like interests; instead of merging multiple audience lists on one campaign, create one campaign per audience. LinkedIn would use lists of company names or job titles; instead of targeting a bunch of big companies, focus on the ones that fit best and categorize them by vertical on separate campaigns. Narrow targeting means specific, tailored target methods structured on unique, separate campaigns.
We need all target methods to be categorized and structured separately, each of them being distinct from one another, reporting data separately. This will improve the following:
- AI will learn faster. (fewer variables per campaign).
- Reporting is clean.
- Clean reporting lets you read data faster and substantially more efficiently. (explaining in rule #4).
By reporting I don’t mean a DataStudio report or some PDF file summarizing a few widgets. I’m talking about the actual data you see on the ad account itself where you manage the campaigns.
Let’s assume that you offer a Software for Human Resources. You decide to run new ads on LinkedIn. Then, you proceed to create a campaign targeting the following audience segments:
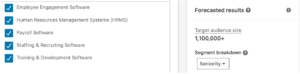
After launching the campaign, you realize that there are only 6 conversions in 2 months. The cost per lead is too large and you must reduce it.
The problem is that you cannot tell which audience segment is performing best because all of the audience targets are merged on the same campaign. LinkedIn doesn’t let you breakdown leads data by audience targets on the same campaign. Now, imagine if all 6 leads came from the audience “staffing & recruiting software”. You could easily pause the other non-converting audience segments and exploit your budget on this one best performing audience list. But, your campaign structure doesn’t let you have visibility on your data. And you will never know. You can raise your bids or increase your budget as much as you want, but it won’t work.. Your PPC campaign is now losing money simply due to poor reporting. Something so simple, yet very expensive. But simplicity is a beautiful thing. What should we do?
Instead, you could literally take the same audience list and break it down into 5 different campaigns, each of which would be named after its target audience. Then, your campaigns would look as follows:
- Lead Form Campaign: Employee Engagement Software.
- Lead Form Campaign: HR Management Systems (HRMS)
- Lead Form Campaign: Payroll Software
- Lead Form Campaign: Staffing & Recruiting Software
- Lead Form Campaign: Training & Development
Most people would not go for this setup because that means you have to create ads separately; or if you need to update one banner, you now have to apply the same adjustments 5 times instead of just 1. You must always choose a heavier management lift if that means better visibility on your data.
As we can see above, poor campaign structures and broad targeting result in the same problem:
- Data unavailable.
- No visibility.
- These turn into poor decision-making.
- Which then turns into losses instead of profits.
You may think I’m overreacting. But, most of what we do with PPC campaigns is reading and analyzing data. So, proper reporting is crucial for success. Let’s talk about it.
Understanding Trends
About 70% of the time related to campaign management falls under “reading and analyzing data”. In fact, creating campaigns or ad groups or doing keyword research is not as time consuming as reading data – that is, when done properly.
Imagine that a light bulb goes off at your house. Then, you call the electrician. The electrician arrives and checks the light bulb. He unscrews a few things and puts them back together again in one minute. The light bulb turns on immediately and you say, “Wow, that was so fast and easy. How much do I owe you?”.
The electrician replies, “that would be $300”. You reply with contempt about the high price, claiming that there was barely an issue and it was easily fixed within a minute. The electrician replies, “if it was that easy, why didn’t you do it yourself?”.
The electrician is selling his knowledge. We are not in the business of selling change entries. We are in the business of delivering PPC solutions with proven results, whether that is by creating one campaign or many, whether that is by applying 1,000 change entries per month or just 20. The quality of the work relies on knowledge. Making the right decisions at the right time. This can only be achieved by understanding the data and trends.
Example
You may cringe at the following example because it’s so obvious. But, in real life, you would be surprised how easy it is to mix reports and misinterpret data right in your nose.
On the following widget, 90% of all conversions are coming through Mobile Devices – what’s wrong with computers? Some people might remove computers because they are not reporting enough conversions. “Let’s put all the money on mobile devices instead,” they would claim.

However, computers are reporting fewer conversions because the search volume is simply lower. Here is the same widget reporting number of clicks:
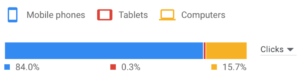
In fact, the cost per conversion is slightly lower on computers compared to mobile devices:

We can then conclude that the performance on computers is great. Do you agree? Please, stop for a minute and think of an answer before reading further.
The problem is that this view from Google Ads is just one layer of information. It’s very limited. If we add another layer of data, we can find out more interesting stuff. Let’s go to Google Analytics and segment all sources of traffic by devices. What is the CPA?
Organic: CPA of computers is $15.
Direct: CPA of computers is $10.
Referral: CPA of computers is $12.
By adding another layer of information, we are able to figure out that computers through Google Ads are converting at twice the cost as compared to other sources of traffic. There must be something going on here, and we should find out.
The problem in this example is that even truthful, factual data can deceive you. Is the data from Google Ads wrong? No at all. Were you wrong by concluding computers were performing great before? Of course not. You made a decision with factual data. You just had a very narrowed picture of a broad landscape.
Reading and interpreting data is very similar to reading a book, perhaps a science fiction fantasy novel. There are multiple chapters, and there is also a sequence to follow. If you skip from chapter 5 to chapter 10, you would not understand the story. You are missing out.
Remember to read the story of your campaigns. This is the key for making profits.